

An electric car still weighs two tons and drinks kilowatt-hours like a thirsty herd, while a velomobile slips through the air sipping a fraction of that energy. Most green buyers have never heard of one. Set the two side by side, honestly and without marketing, and the efficiency gap is startling — in energy, in batteries, and in lifetime emissions.
1. The Environmental Impact of Velomobiles at a Glance
The Environmental Impact of Velomobiles starts with a simple contrast the wider electric car conversation tends to skip. The electric car is celebrated as the green future, yet at 4,000 lbs it is a heavy answer to a transport question. The velomobile takes the opposite approach: a 60-lb aerodynamic shell around a human-electric drivetrain that moves a person on a tenth of the energy, in the original comparison’s own framing. Everything else in this article follows from that difference in mass. Energy per mile, battery size, manufacturing footprint, road wear, charging load and lifetime carbon all scale, in one way or another, with how much vehicle you move in order to move one person.
That does not make the velomobile the right answer for every trip, and this comparison keeps the honest limits in full view. A car still wins on long distance, bulky cargo, carrying a family and severe weather. What the velomobile claims instead is the commute — the 80% of car miles that are single-occupant short trips. Read the table first, then work through each attribute in turn.
| Attribute | Detail |
|---|---|
| Velomobile weight | 60-lb aerodynamic shell around a human-electric drivetrain |
| Electric car weight | 4,000 lbs — two tons moved to move one person |
| Energy per mile — velomobile | 8–15 Wh/mile |
| Energy per mile — electric car | 250–350 Wh/mile |
| Energy per mile — e-bike | 15–25 Wh/mile |
| Battery size — velomobile | 0.5–1.5 kWh |
| Battery size — electric car | 60–100 kWh |
| Lifecycle carbon — velomobile | ~3–10 g CO₂/mile |
| Lifecycle carbon — electric car | ~50–100 g CO₂/mile |
| Charging — velomobile | 100–200W, from any outlet or a single 200W solar panel |
| Parking — electric car | 300 sq ft demanded; the velomobile parks in a bike rack |
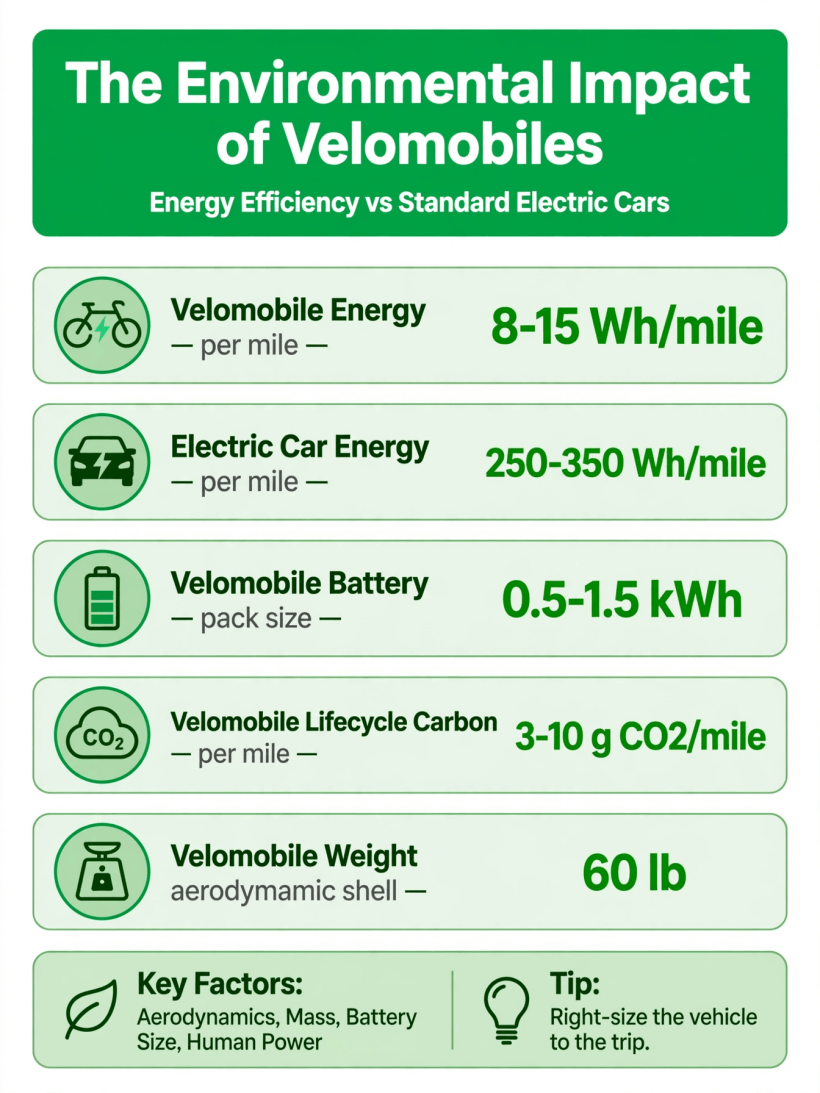
Energy, battery, weight and lifecycle carbon for a velomobile, set against a standard electric car, using only the figures carried through this comparison.
2. Velomobile Energy per Mile vs Electric Car Energy per Mile: The Physics of Mass
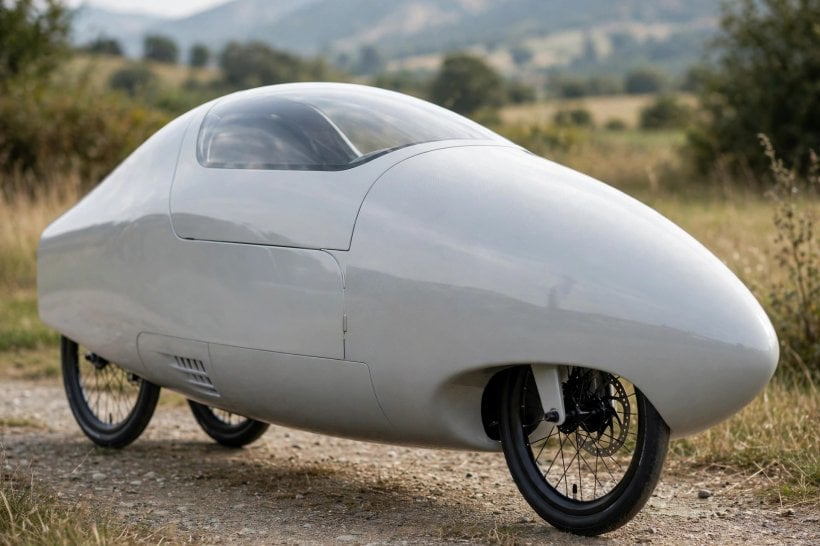
Energy per mile is where the comparison becomes brutal, because of one underlying attribute: mass. The original figures put a standard electric car at 250–350 Wh/mile, described as the Tesla-to-truck range. That is the energy needed to move two tons in order to move one person, and no drivetrain cleverness changes the basic physics of mass behind it.
Set against that, an e-bike uses 15–25 Wh/mile — an order of magnitude less, built on the bicycle’s inherent efficiency with a motor added. The velomobile goes further still, at 8–15 Wh/mile. The original calls it the champion, and explains why in one line: aerodynamics multiply the human engine. The enclosed shell cuts the air resistance that an upright rider fights, so the same human effort, lightly assisted, carries the rider much further for the same energy. The original sums the effect up with a memorable image — the 100-mile ride on a sandwich — because the human part of the fuel really can be that small.
The ratio is the number the original says ends the debate: the velomobile uses around 1/25th of the energy per mile of an electric car. If the goal is simply to move a person from home to work and back, spending far more energy to do it is the central fact. The mass, as the original puts it, is the message. For the aerodynamic side in more depth, see velomobile aerodynamics, drag coefficients and speed limits and the physics of velomobiles and why aerodynamic shells make you faster.
3. Velomobile Manufacturing Footprint: The Battery Question
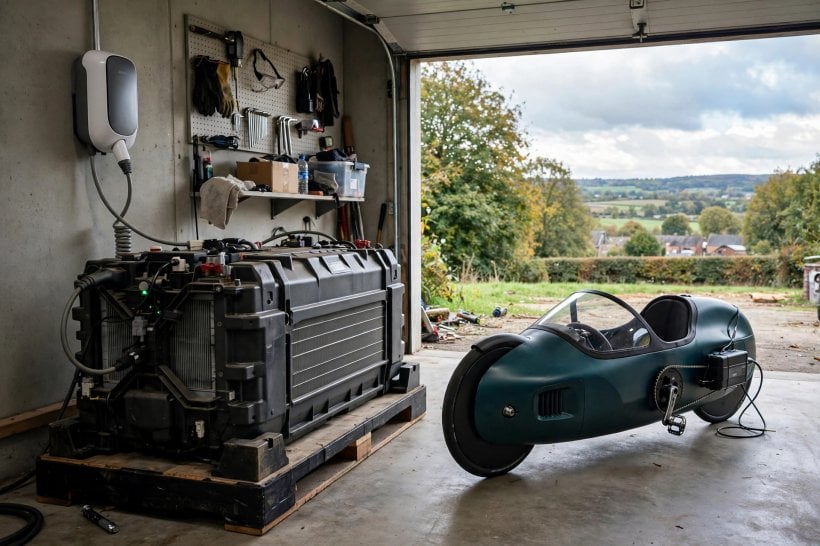
A vehicle’s footprint does not start at mile one on the road. It starts in manufacturing, and in the original’s framing the battery is the question that dominates that footprint. An electric car battery is sized at 60–100 kWh, and the mining behind it — lithium, cobalt and nickel are the materials named — carries a heavy cost before the car travels anywhere: 8–12 tons of CO₂ to manufacture the pack alone, in the original’s figures. That is the footprint before mile one, a manufacturing debt the car then has to repay through cleaner driving.
The velomobile’s battery sits in a completely different class. At 0.5–1.5 kWh it is in the same class as an e-bike battery, which the original sizes at 0.5–1 kWh and describes as 1% of the EV pack, with a proportional footprint to match, recyclable at bike shops. The rest of the velomobile is not a steel car body either: the shell is fiberglass or carbon, wrapped around a human-electric drivetrain. Less battery, less material, less vehicle — the manufacturing story is smaller at every step, simply because there is so much less vehicle to manufacture in the first place.
The amortisation comparison makes the consequence concrete. The original states that an electric car needs 30,000–60,000 miles to carbon-break-even against a gas car — that long repayment is the manufacturing debt being worked off mile by mile. The velomobile’s manufacturing footprint, by contrast, pays back in hundreds of miles. A vehicle that starts with almost no carbon debt is ahead of the ledger almost as soon as it is in regular use.
4. Velomobile Lifecycle Carbon: The Full Accounting per Mile
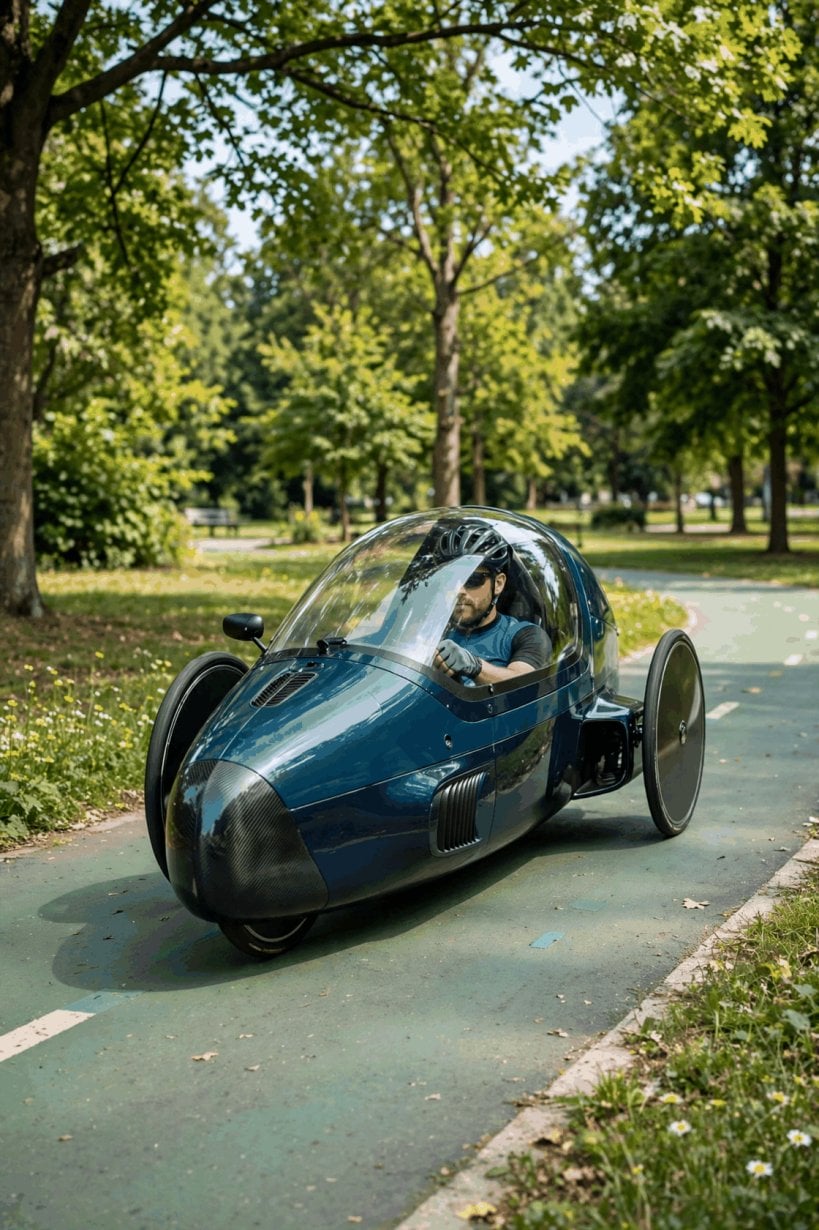
Lifecycle carbon is the full accounting: manufacturing, energy in use, and everything in between, expressed per mile. On that measure the original gives the electric car a range of around 50–100 g CO₂ per mile, and it is careful to call that range grid-dependent — cleaner on renewables, dirtier on coal. That honesty matters. An electric car is not a fixed footprint; its per-mile figure moves with the electricity that feeds it, which is why the range is wide and why where and how it charges changes the answer.
The lighter vehicles sit far below that range. An e-bike comes in at around 5–15 g per mile, described as near-zero, with the caveat that in serious analyses even the food the rider eats is counted. The velomobile is lower again, at around 3–10 g per mile — the lowest motorised transport in this comparison. The reason given is elegant: human power displaces battery power. Every watt the rider supplies is a watt the battery does not have to provide and the grid does not have to generate. In the original’s phrase, the rider’s lunch is the fuel, and lunch carries a very small carbon account next to a charged battery pack of car size.
The baseline the original reaches for is walking. Walking is the comparison point, and the velomobile approaches walking’s footprint at 5× the speed. That pairing — foot-scale emissions, bicycle-plus speed — is the lifecycle argument in its simplest form. The conclusion the original draws is blunt: if the goal is decarbonisation, mass is the enemy, and the velomobile is mass’s opposite. Readers working through the wider micro-mobility picture can compare the same class of vehicles in sustainable micro-mobility: e-bikes, cargo bikes and velomobiles compared, and for the household side of the same energy question, how much energy a tiny house uses applies the same use-only-what-you-need logic at home.
5. Velomobile Hidden Impacts: Road Wear, Tire Particles, Space and Noise
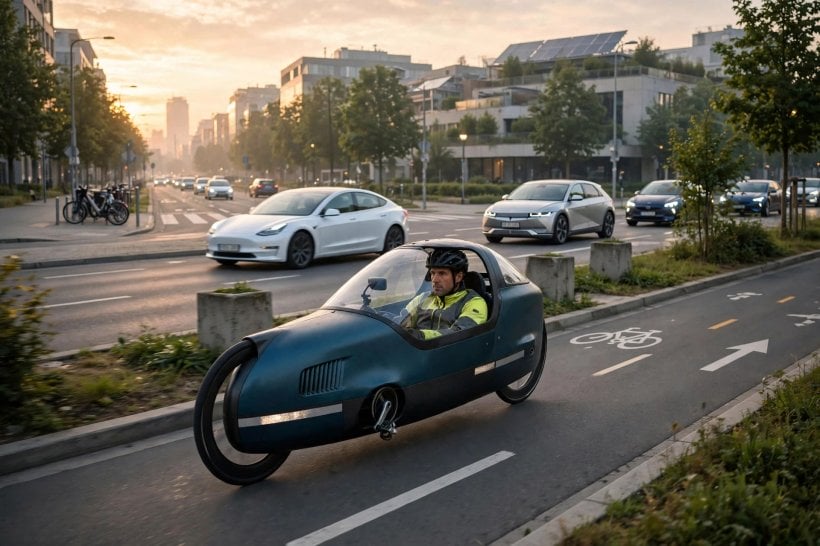
Carbon is not the only impact a vehicle leaves behind, and the original is explicit that the hidden impacts widen the gap further. Start with road wear. Damage, in the engineering rule the original cites, scales with the 4th power of axle weight. Run that rule on the two vehicles in this comparison and the result is dramatic: a 4,000-lb car does around 10,000× the road damage of a 60-lb velomobile. Road damage is not an abstraction — it is resurfacing, repair and infrastructure cost, spread across everyone, and the lightest vehicle on the road contributes almost none of it.
Tire particles are the emerging pollutant in the original’s list. Electric cars shed more tire microplastic, the argument runs, because they are heavier and torquier — more mass pressing and twisting against the road surface with every mile. The velomobile’s bicycle tires, by contrast, shed bicycle amounts. It is a small phrase with a large implication: particle pollution scales with the vehicle, not just with the journey, so shrinking the vehicle shrinks a pollutant that tailpipe-focused accounting misses entirely.
Space and noise complete the hidden ledger. The car demands 300 sq ft of parking, while the velomobile parks in a bike rack — a land-use difference that repeats at every home, office and shop. On noise, the original contrasts the velomobile’s whisper with the electric car’s tire roar at speed: even a near-silent motor is not a silent vehicle once its tires are working. For background on how the human and electric sides share the work, see human power vs electric assist in a velomobile.
6. Velomobile Honest Limits: Where Electric Cars Still Win
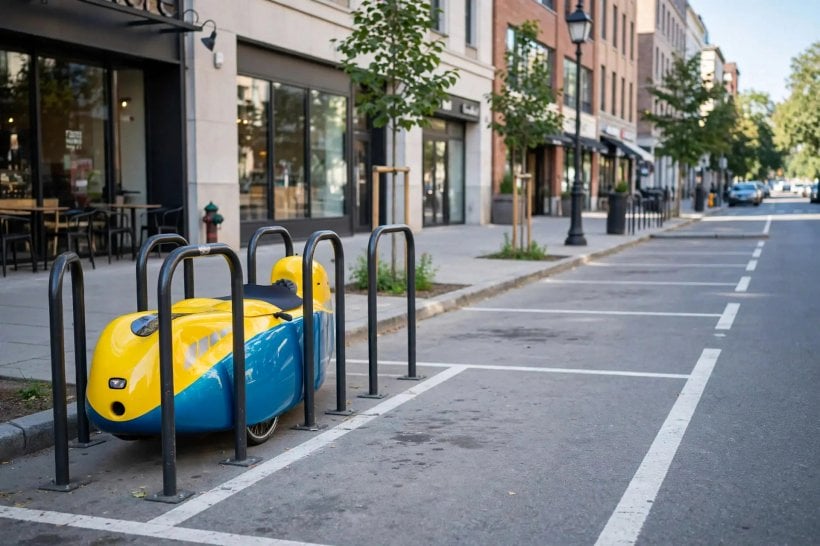
An honest comparison has to give the car its wins, and the original does so without hedging. Distance comes first: the 200-mile trip is the electric car’s domain. The velomobile is a commuter, not a road-tripper, and pretending otherwise would undermine every credible figure elsewhere in this article. Range, sustained speed over long distances and the ability to simply keep going belong to the car, and for the journeys that need them, the car is the right tool.
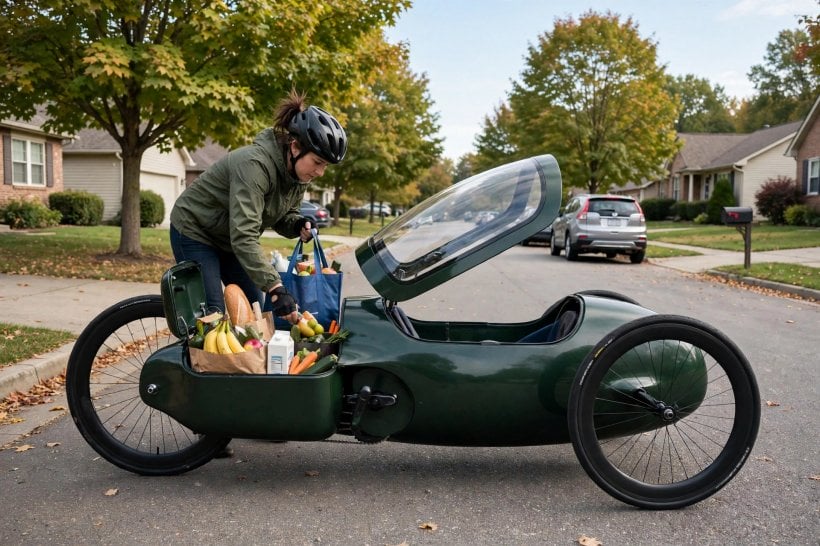
Cargo is the second clear win. The original frames it as the Costco run: the car has a trunk, and the velomobile takes groceries, not furniture. That is a real, everyday distinction. A weekly shop fits the light vehicle; a bulky, heavy or awkward load does not, and households plan around the biggest load they regularly carry as much as around the average one. Passengers draw the same line. The car carries five; the velomobile carries one. The original notes that the tandem exists but is rare, which keeps the honest position simple — as family transport, the velomobile is not a substitute.
Weather extremes are the fourth limit, with a useful nuance. The shell handles rain — that weather protection is one of the format’s defining advantages over an open bicycle — but the ice storm, in the original’s phrase, wants the car. Severe weather is an edge case where the heavy, enclosed, four-wheeled vehicle earns its keep. None of this weakens the velomobile’s case, because of the role the original assigns it: the velomobile replaces the commute, the 80% of car miles that are single-occupant short trips. The car keeps the edge cases. A comparison that starts by conceding the edge cases is free to be uncompromising about the centre — and the centre, by mileage, is the short solo trip. New to the format itself? What is a velomobile? Its history, aerodynamics and future is the place to start.
7. Velomobile Charging and the Grid Question: Kilowatt Loads vs a Laptop Brick
Charging is where the two vehicles meet the grid, and they meet it at utterly different scales. The original puts electric car home chargers at 7–11 kW and names the consequences directly: the grid impact, the transformer upgrades and the peak-demand problem. A charger drawing at that rate is a major household load, and when many of them run at the same evening hour, the local network feels it. The car’s energy appetite does not end with how much it uses per mile; it extends to how forcefully it demands that energy back, all at once, at the plug.
The velomobile charges at 100–200W. The original’s comparison is a laptop brick, and it earns the comparison: the velomobile charges from any outlet, any solar panel, and the grid does not notice. No dedicated circuit, no upgraded supply, no peak-demand contribution worth measuring. The charging infrastructure for the lightest vehicle in this comparison is, essentially, the infrastructure that already exists in every room. That invisibility is an environmental attribute in its own right, because infrastructure has a footprint too — chargers, upgrades and reinforced networks are all manufactured, installed and maintained with real materials and real energy.
The same right-sizing logic also shrinks a home’s energy demand, which is why the off-grid context suits this vehicle so well. Readers planning that side can work through how to live off grid in a tiny house, where modest, well-matched demand is the whole design principle.
8. Velomobile Off-Grid Charging: The Renewable-Native Vehicle
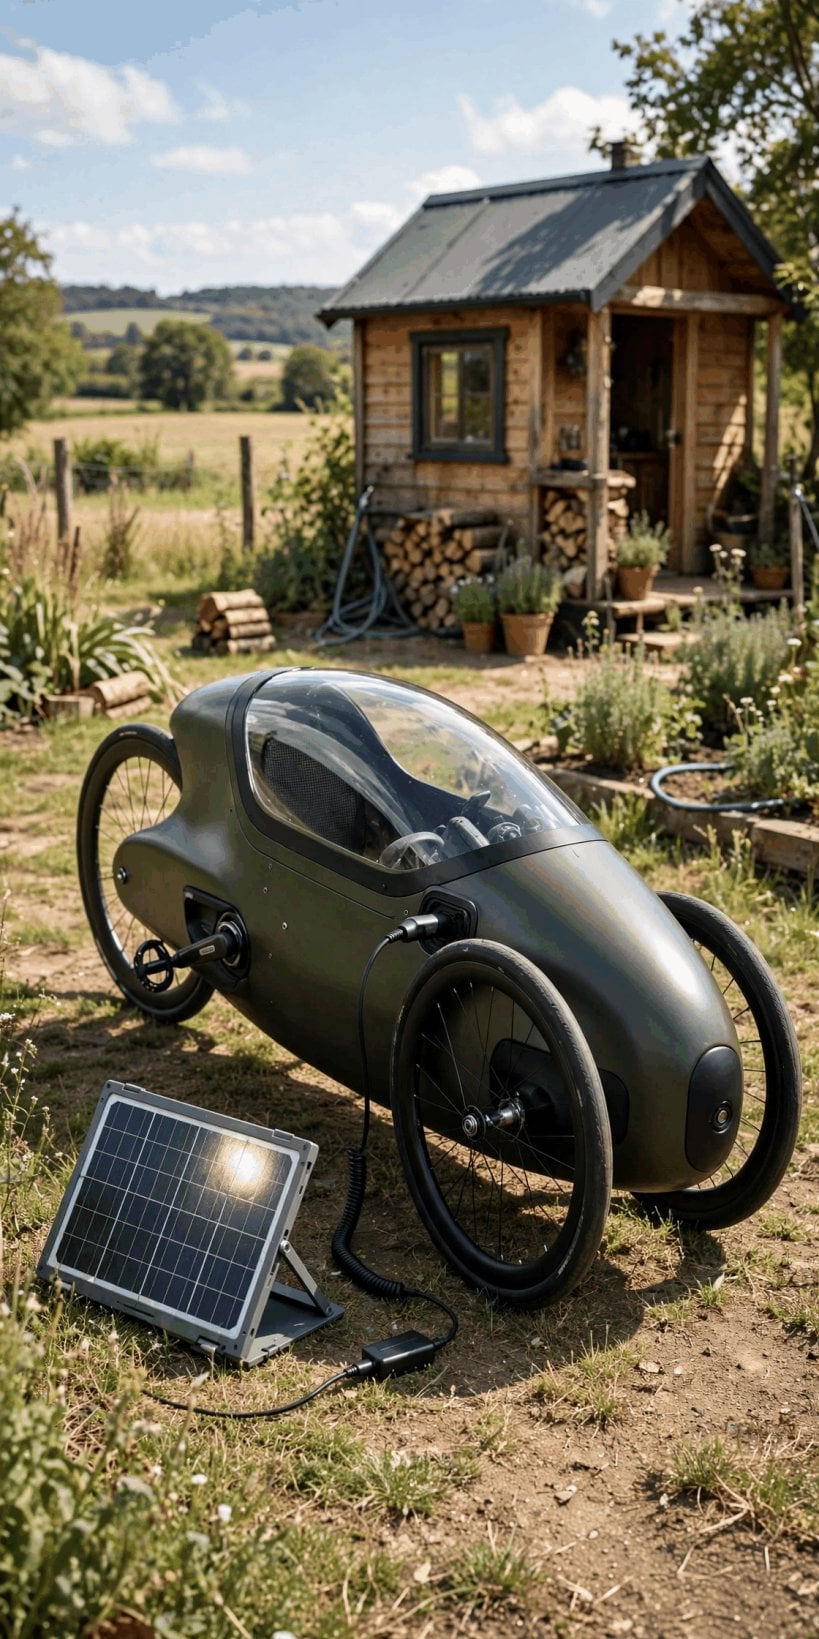
Off-grid, the original calls the velomobile decisive, and the numbers show why. A velomobile charges from a single 200W panel. An electric car, to charge from solar in the same self-sufficient sense, needs a 5kW+ array. That is the homestead math in one sentence: one vehicle’s charging demand fits a single panel, while the other’s demands an installation. For anyone generating their own power, the difference decides whether vehicle charging is a minor line in the energy budget or the project that dominates it.
The original’s conclusion is that the velomobile is the renewable-native vehicle: its energy needs fit what a homestead roof already produces. Plenty of vehicles can be charged from renewables in principle, if the array is big enough. The velomobile asks for so little that the supply a small property can realistically generate is already sufficient, with the same ordinary outlet-and-brick charging described above. Its fuel is small enough to be clean by default in a way the car’s cannot be.
A vehicle running at 8–15 Wh/mile, charged from a single panel, sits at the clean end of that 3–10 g CO₂ per mile range by construction rather than by hope. The grid-dependent warning that applies to the electric car’s range barely applies here, because there is so little grid in the equation to begin with.
9. Velomobile Right-Sizing: One Car, One Velomobile, and the Household Fleet
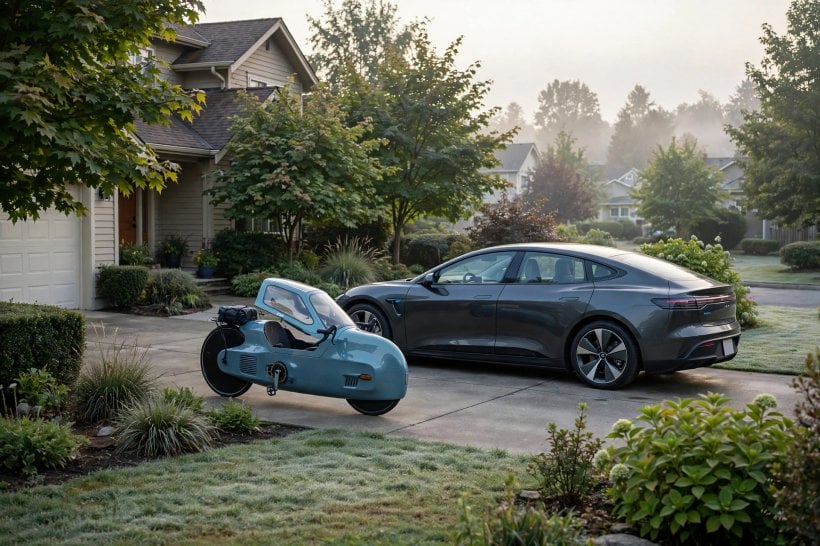
The verdict section of the original is built on a principle rather than a product: use the smallest vehicle that does the job. Right-sizing, in that framing, assigns the velomobile to the commute, the e-bike to errands, and the car to the edge cases. Each vehicle does the work it is proportionate to, and none of them spends its life doing a job far below or far above its design. It is the same logic as the rest of the comparison, generalised — the footprint of a trip should be set by the trip, not by the largest vehicle the household happens to own.
Applied to a household, the original’s optimised pattern is one car plus one velomobile. The car idles most days; the velomobile does the miles; the fleet carbon plummets. The car is still there for the 200-mile trip, the furniture run, the family and the ice storm. It is simply no longer used, at 250–350 Wh/mile and around 50–100 g of lifecycle CO₂ per mile, for the short solo trips that dominate actual mileage.
The ownership side of that swap is deliberately outside this article’s environmental scope, but readers weighing the practical commitment can check the cost of owning a velomobile, including purchase price, maintenance and insurance before drawing their own household conclusion.
10. Velomobile Policy and the Personal Verdict: The Energy Advantage, Counted
The original extends the right-sizing argument to policy, and states its position as a conditional: what we would subsidise if carbon mattered. On that test, it claims e-bike and velomobile incentives per ton of CO₂ avoided beat EV subsidies 10:1. Whether or not a reader accepts that ratio, the reasoning underneath it is the same arithmetic as the rest of this comparison — a small, cheap, light vehicle that displaces car miles avoids carbon at a fraction of the hardware cost of a large one, because there is so much less hardware involved in avoiding it.
The personal version needs no policy at all. It is the 25× energy advantage, restated from the rider’s seat: every velomobile mile is 24/25ths of an EV mile unburned. The commute does not become slightly greener on the lighter vehicle; on the original’s figures it becomes far lighter in energy, with a much smaller battery, far lower road damage, and a charging demand the grid does not notice.
Final Considerations
The electric car is a cleaner heavyweight; the velomobile is a different sport entirely. The original’s closing summary gathers the comparison into one line: 1/25th of the energy, 1/100th of the battery, solar-chargeable from a single panel, and approaching walking’s footprint at cycling’s speed. Every one of those claims has been worked through above on the original’s own figures — 8–15 Wh/mile against 250–350, a 0.5–1.5 kWh battery against 60–100 kWh, 3–10 g of lifecycle CO₂ per mile against 50–100, a 60-lb shell against 4,000 lbs of car.
Right-size the vehicle to the trip, and the conclusion follows. The commute — the 80% of car miles that are single-occupant short trips — stops being a carbon problem when the vehicle doing it weighs 60 lb, charges at 100–200W and parks in a bike rack. The car keeps the distance, the cargo, the passengers and the ice storm. The everyday mile belongs to the lightest vehicle that can do the job.




3 Comments