

Wildfire smoke over the suburbs, hundred-year floods arriving every spring, insurance companies quietly abandoning whole counties — the climate map is being redrawn, and where you put down roots matters more than it ever has. Gut feelings and nostalgia are terrible relocation advisors; data is better. This analysis measures the risks that matter, names the regions holding up best, and shows the migration already underway. Move with your eyes open.
1. Where to Move to Survive Climate Change at a Glance
Deciding where to move to survive climate change is a measurement problem before it is a moving problem. Climate change is redrawing the habitability map — water, heat, fire and sea level now belong in every relocation decision, alongside the price, soil and access questions that have always governed buying land. This analysis scores US regions on the climate risks that matter for a 30-year homestead horizon: not the weather outside the window today, but the climate a household will actually live in across the life of a mortgage. The table below gathers the whole framework in one place; the sections after it take each risk, region and data source apart in turn.
| Attribute | Detail |
|---|---|
| The Horizon | 30 years — score the climate of 2055, not today’s weather |
| The Priority Order | Water first, then heat, then fire, then storms — the irreplaceable ranked first |
| The Heat Metric | Wet-bulb temperature — 95°F is the human survivability limit |
| The Water Test | The aquifer’s trend and the well’s future — the Colorado River’s decline is the warning |
| The Fire Test | Distance from the wildland-urban interface, and whether insurance is still written there |
| The Sea Test | The 3-foot century — Florida, Texas and Gulf exposure set against a 30-year mortgage |
| The Winning Formula | Fresh water + elevation + moderate latitude — and inland |
| The Resilient Regions | Upper Midwest and the Great Lakes, inland New England, the inland Pacific Northwest, Appalachia |
| The High-Risk Zones | The Southwest, the Gulf Coast, South Florida and the wildfire West |
| The Market Signal | Insurers are withdrawing from Florida, California and Louisiana — the actuaries move first |
| The Action | Score candidate land on the 100-point system, with the climate layer added |
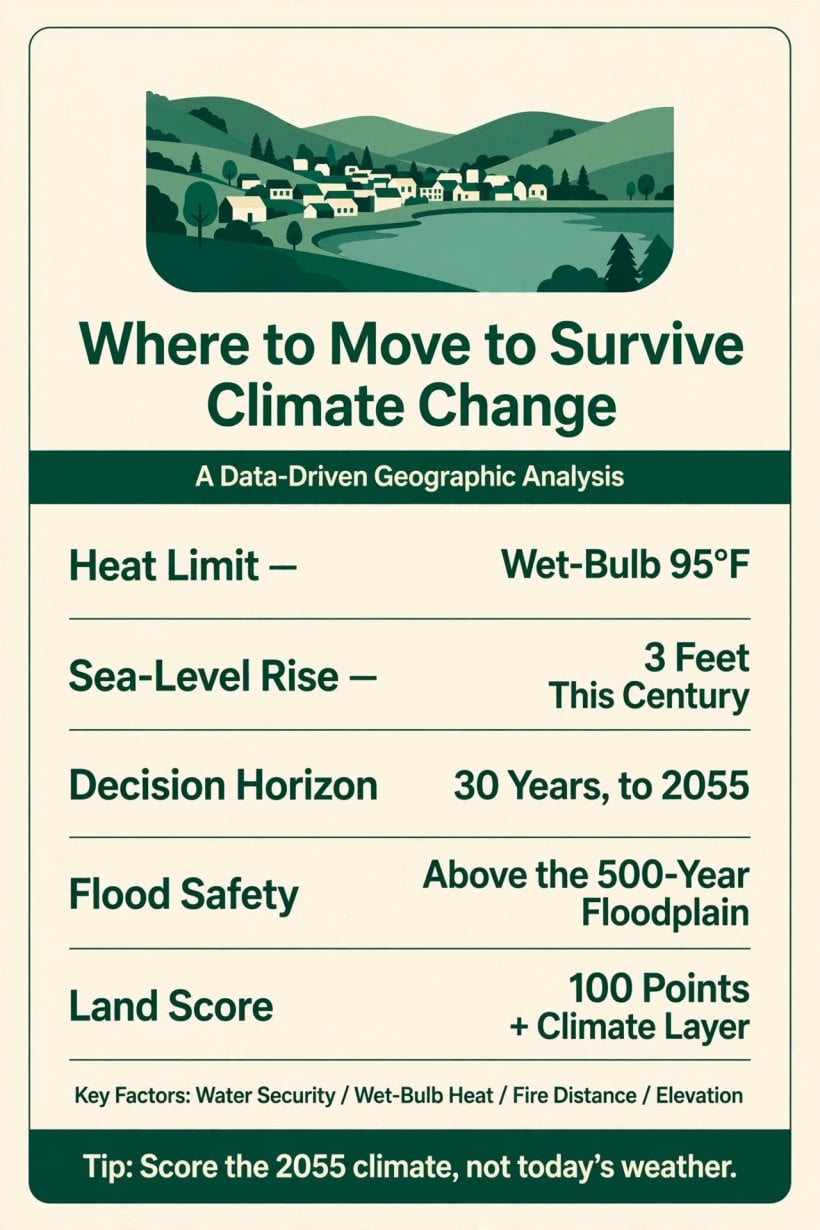
A 95°F wet-bulb limit, a 3-foot sea, a 30-year horizon and a 100-point score — the relocation decision on one card.
Read the table as a dependency chain. Water sits at the top of the ranking because it is the one attribute no money reliably replaces: a household can shade a house, clear defensible space and build above a floodplain, but it cannot manufacture an aquifer. Heat follows because it is scored against a hard physiological limit rather than a comfort preference. Fire and storms come after because distance and construction can still negotiate with them. And the whole ranking is applied across thirty years, because that is the honest unit — the mortgage and the homestead both run on it, and the climate that matters is the one at the end of the term, not the beginning.
2. The Risks: What to Measure
Five risks decide whether a location holds up, and each has a metric rather than a mood. Heat is measured in wet-bulb temperature, the survivability metric that combines heat and humidity into the number a human body actually experiences. Water is measured in the aquifer: the trend of the groundwater beneath a parcel and the future of the well drilled into it. Fire is measured at the wildland-urban interface, the boundary where housing meets flammable landscape. Sea level is measured against the coasts, in the feet of rise projected across the century. Storms are measured by corridor — the hurricane and tornado belts — and by intensification, the direction the storms themselves are travelling.
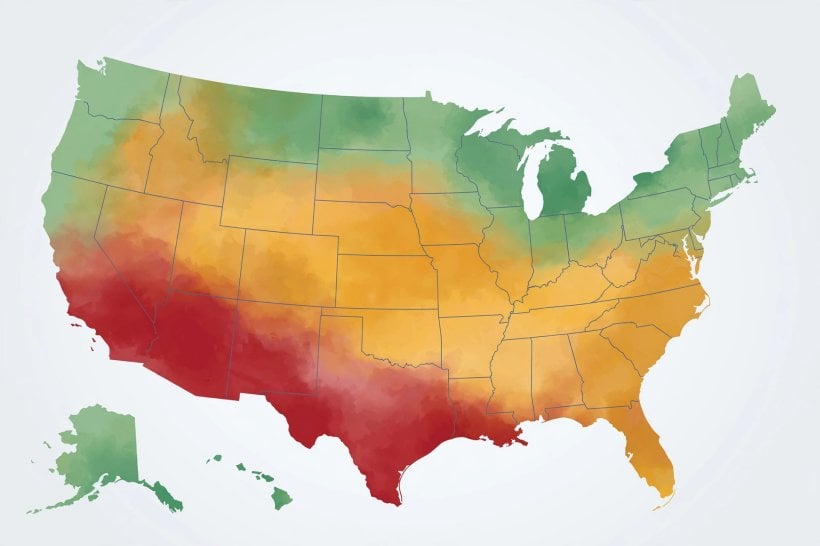
The discipline underneath the list is that every risk is scored as a trend, not a snapshot. A county’s current average temperature matters less than its projected one; a well’s current yield matters less than the direction of the water table beneath it; a coastline’s current flood record matters less than the sea-level arithmetic applied to a thirty-year holding period. Storm corridors deserve the same treatment: the question is not whether a county sits in the hurricane or tornado belts — the map answers that at a glance — but how the storms inside those corridors are intensifying, because a corridor of strengthening storms reprices every roof within it. Relocation decisions fail when they are made on the climate of the past — the climate the seller remembers, the climate in the listing photographs. The five measurements exist to replace that memory with the projection.
3. Heat: The Wet-Bulb Limit and the Humid Southeast
Heat is the risk most often mismeasured, because the thermometer alone does not describe it. The wet-bulb temperature — heat and humidity combined — is the survivability metric: at 95°F wet-bulb, the human body can no longer shed heat by sweating, and that figure is the human limit. A dry 110°F afternoon and a humid 95°F one are different events physiologically, and any scoring that reads only the dry number will rank humid regions as safer than they are.
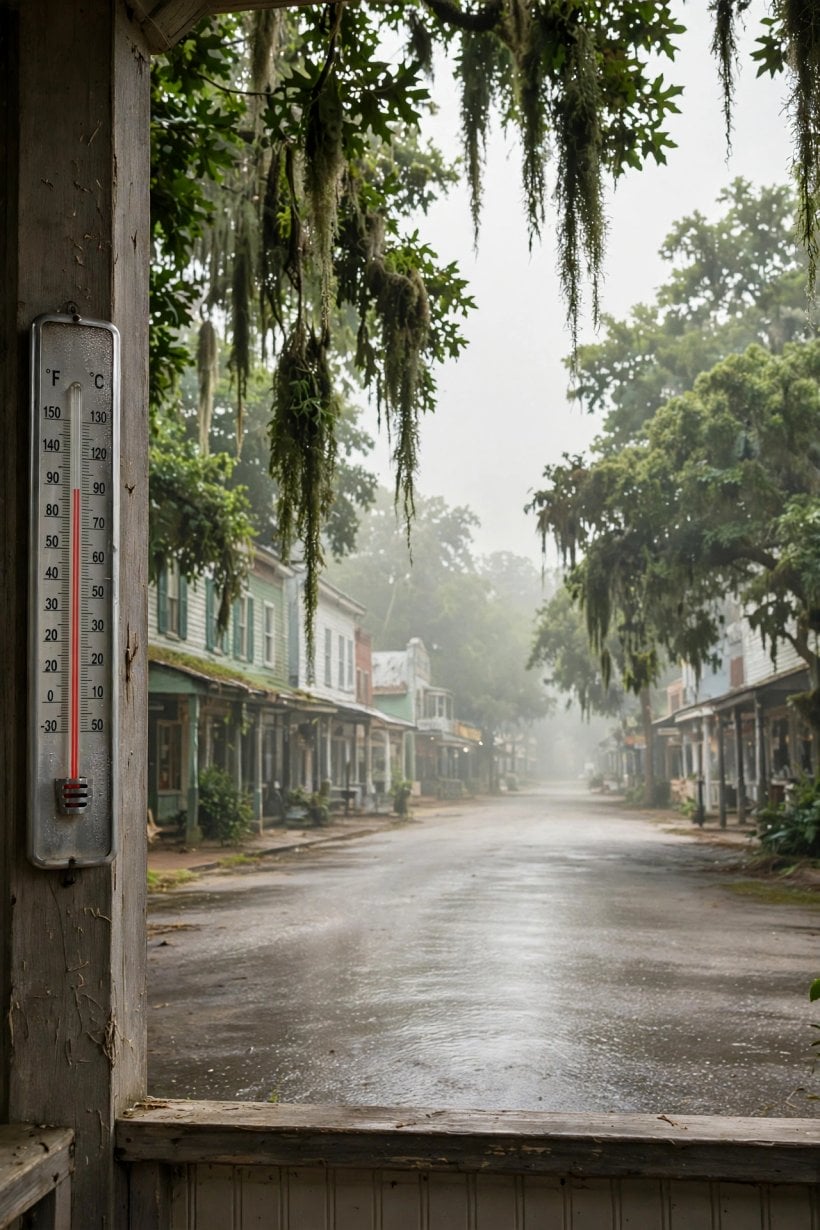
The Southeast is where this metric bites first in the American picture: rising humidity layered on rising heat pushes wet-bulb readings upward in exactly the region where air conditioning already carries the summer. That is why the homestead scoring in this framework checks heat habitability against the projected 2050 summer rather than the present one — the wet-bulb check, applied to the climate of mid-horizon. A location whose 2050 summer stays comfortably below the limit passes; a location trending toward it fails on a trajectory, however pleasant its current Julys feel on a viewing trip.
4. Water: Aquifers, Rivers and the Well’s Future
Water security is scored on a 30-year view, and its first instrument is the aquifer trend. Groundwater is a stock being drawn down in much of the dry West, and the direction of that draw-down — visible in the well logs’ direction over time — decides whether a well drilled today is a thirty-year supply or a wasting asset. The Southwest’s depletion is the standing example: an aquifer in decline reprices every parcel above it, whatever the surface looks like in a wet spring.
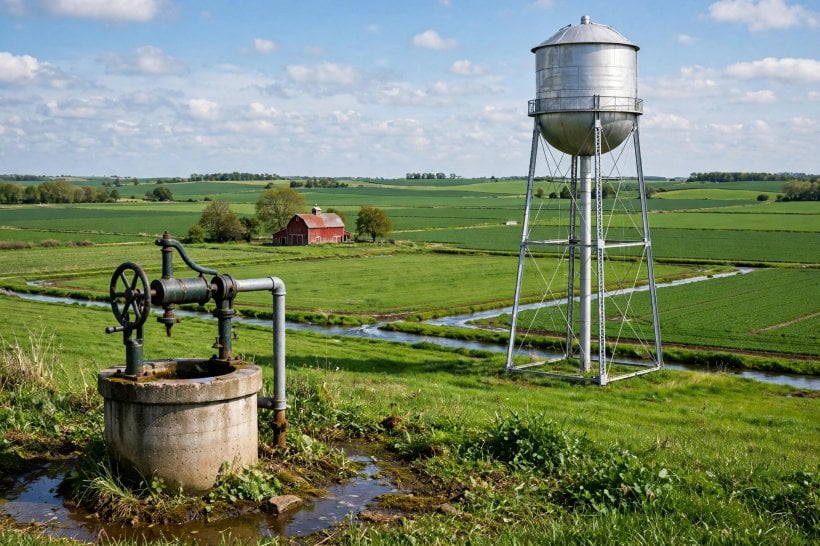
The Colorado River’s decline carries the same lesson at regional scale: a great river’s shrinking flow is the surface signature of a water balance that no longer closes. The rainfall projection completes the category — how much rain the parcel’s future climate delivers, and therefore how much of the household supply the sky can carry. That is where harvesting stops being a hobby and becomes a scored input: the method in the rainwater harvesting and tank sizing guide turns a rainfall projection into tank volumes and roof areas. Rights come with the rain, and they vary by state — the legality of collecting rainwater check belongs in the same scoring pass, before the land is bought rather than after.
5. Fire and the Rising Sea: The Interface and the Coast
Fire risk lives at a boundary: the wildland-urban interface, where subdivisions press into flammable country. The West’s fire seasons have lengthened into that boundary, and the scoring question is distance — the miles from the interface, which buy down both the flame risk and the smoke that travels far beyond it. Defensible space is the parcel-level mitigation, the cleared and managed ground around a house; it is real, and it is also the reason fire ranks below water and heat in the priority order — a household can manufacture defensible space, but it cannot manufacture distance after the purchase, so the distance must be scored before it.
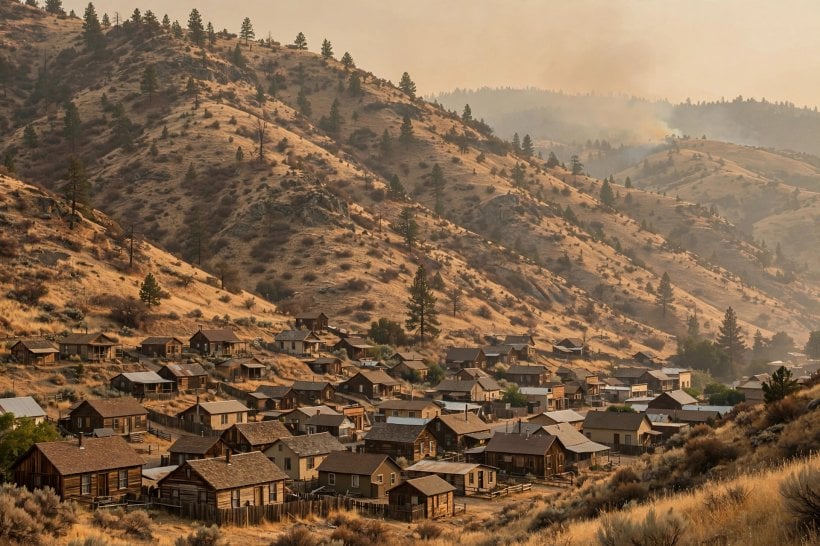
The sea presents the mirror problem: a boundary moving toward the house. The framework’s figure is the 3-foot century — roughly three feet of sea-level rise across the hundred years — applied to the Florida, Texas and Gulf exposure. Three feet sounds modest until it is laid against flat coastal land, where it converts storm surge into inland flooding and ordinary high tides into street water. The insurance maps already draw this future, which is why the sea test and the market signal in this analysis keep arriving at the same counties from opposite directions.
6. The Winners: Where the Formula Points
The resilient regions share a formula, and it is worth stating before the names: fresh water, elevation and moderate latitude, inland. The Upper Midwest and the Great Lakes are the formula’s clearest expression — fresh water in abundance, moderate warming, and the climate haven narrative that follows from both; Michigan, Wisconsin and Minnesota are the water-rich states at its centre. Inland New England is the temperate entry: Vermont, New Hampshire and inland Maine, with water, real seasons and a moderating climate — expensive, but stable.
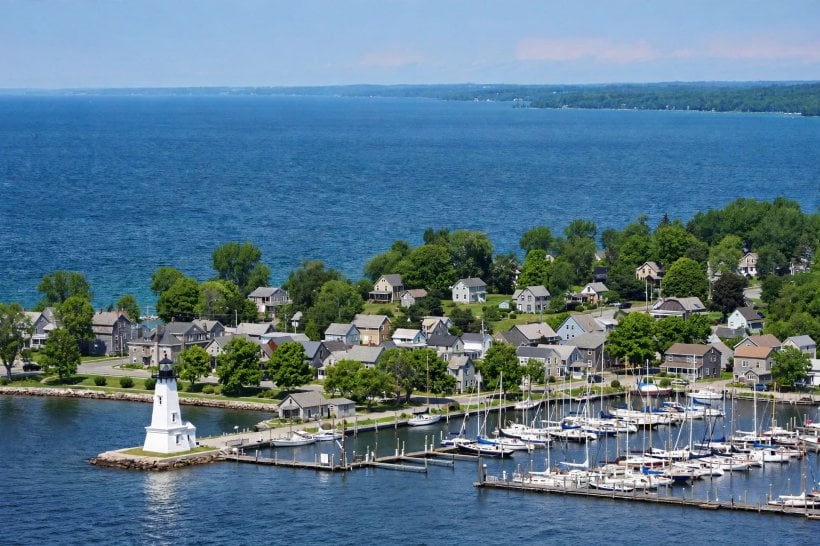
The inland Pacific Northwest — east of the Cascades — is the water entry with a caveat: the rain shadow’s balance of moisture and sun, scored carefully because the fire caveat belongs to the west side of the range and smoke respects no crest. Appalachia is the elevation entry and the underrated one: highlands with water, elevation and affordability in combination that the coastal markets have not repriced. The formula travels beyond rural land, too — the city-scale version of the same scoring is worked through in the guide to the best US cities for urban agriculture and sustainable living codes. And a homestead planted in any of these regions still has to make its own energy decision, which the solar vs wind for the homestead comparison settles site by site.
7. The Losers: Zones on a Bad Trajectory
The high-risk zones fail on trajectory rather than on any single bad year. The Southwest is the water crisis in its purest form: Phoenix’s 120°F heat on the surface, aquifer decline beneath it, and a trajectory the framework calls uninsurable — not because any one summer is unsurvivable, but because every trend line points the wrong way at once. The Gulf Coast stacks three risks into a triple: sea level, hurricanes and heat together, with the insurance collapse already underway as the market’s verdict on the stack.
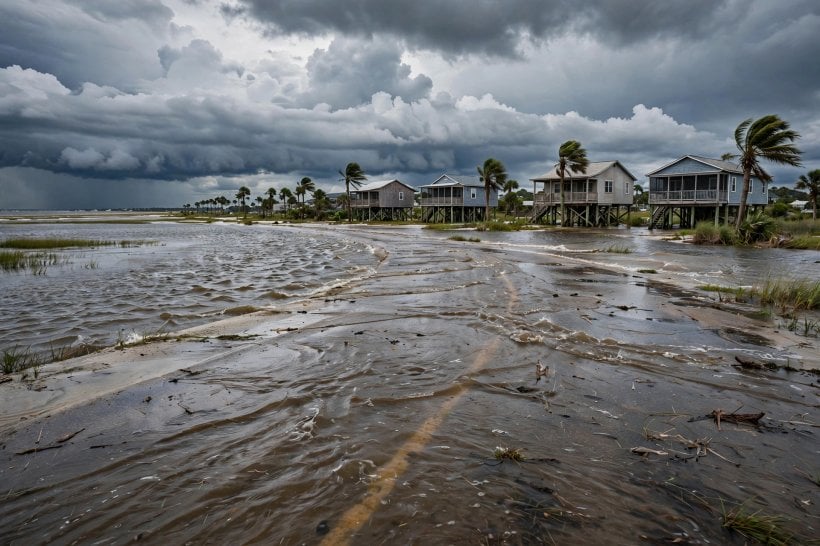
South Florida is the sea alone, which is enough: sunny-day flooding — tidal water in the streets on clear days — is the 3-foot math arriving early, and it sets up the region’s defining collision, the 30-year mortgage against the 30-year sea. A loan written for three decades is being repaid against a shoreline that will not hold still for one of them. The wildfire West completes the list at the interface: fire, smoke and insurance exposure braided together — defensible, parcel by parcel, but exposed, region by region, for as long as the houses keep pressing into the fuel.
8. The Data Sources: Where the Numbers Live
None of this scoring requires private information. FEMA’s risk index is the first source: county-level, built on expected annual loss, and free — the federal government’s own arithmetic on where disasters cost the most. The Climate Explorer is the second: county futures, the temperature and precipitation deltas projected for a specific county, which is what turns a national argument about climate into a local decision about a parcel.
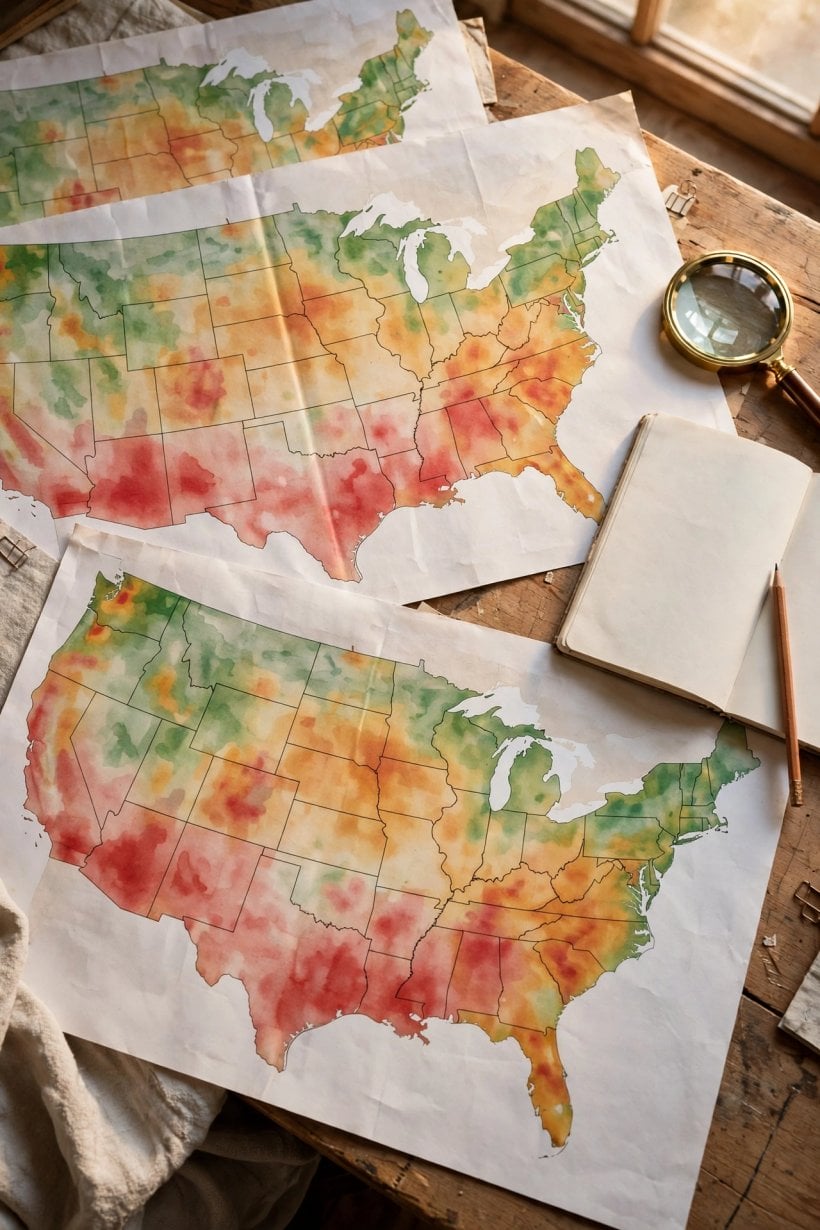
The third source is not a dataset but a market: the insurance signal, read in the withdrawing insurers. Actuaries price risk for a living, and a carrier’s exit from a county is a priced opinion about that county’s future — the canary in this coal mine sings in premium notices. The fourth source is the USDA’s growing zones, quietly migrating north and updated on a five-year cycle: the garden’s evidence, recorded by the agency that maps where plants survive. A gardener’s zone changing under a fixed address is the whole argument of this analysis in miniature — the map moved, whether the household did or not.
9. The Migration Already Happening: The Evidence
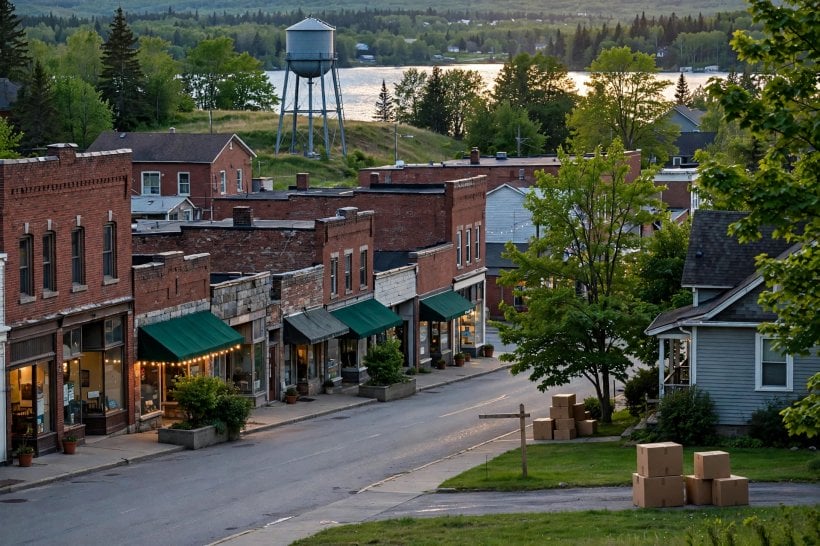
The migration this analysis points toward is not hypothetical; it is observable in three directions. The insurers move first: carriers withdrawing from Florida, California and Louisiana are the actuaries voting with their balance sheets, and an uninsurable county is a county whose risk has been priced by professionals and found too high. The haven towns show the inflow: Duluth, Buffalo and Vermont towns are named as receiving climate migrants, with prices responding to the arrivals — the haven premium arriving in the housing data before it arrives in the headlines.
The corporate signal is the third direction: data centers, sited on water and power, represent industry’s climate calculus made concrete — the largest site-selection budgets in the economy quietly scoring the same two inputs this framework puts at the top of the homestead list. When the insurers, the haven towns and the corporations are all reading the same map the same way, the map is no longer a projection; it is a market. The household that reads it early buys before the repricing; the household that reads it late pays the haven premium the early readers created. The money side of joining the inflow is its own discipline, worked through in the homesteading economics guide, and the practical side — staying connected from a rural haven — in the off-grid internet guide. The lesson the original draws from all three directions is the same: follow the insurers. The money knows, because the risk is priced.
10. The Decision Framework: Score the Climate of 2055
The framework assembles into a sequence. Set the horizon first: thirty years, the mortgage plus the homestead, which means the climate that matters is 2055’s. Rank the priorities second: water above heat above fire above storms, the irreplaceable first. Accept the trade-offs third: the perfect location does not exist, and the haven’s winters are the honest cost of the haven’s water — a cost paid in a currency, cold, that clothing and wood stoves can answer, unlike the currencies of aquifer decline and sea-level rise.
Then score the parcel, using the homestead scoring in its climate edition: water security across thirty years, from the aquifer trend and the rainfall projection; heat habitability in the 2050 summer, by the wet-bulb check; fire distance, in miles from the interface, with insurance availability as its proof; elevation, read off the FEMA maps, the parcel standing above the 500-year floodplain rather than in it; and food, the growing zone’s future — the garden’s viability in 2050, not its performance in the last mild season. Feeding that future garden is a soil discipline as much as a climate one, which is why the composting chemistry guide belongs in the same folder as the climate maps. The scoring instrument itself is the companion guide: the land scoring system for eco-living supplies the 100-point total, and this analysis adds the climate layer on top of it.
Final Considerations
Favor the inland, the elevated and the water-rich — the Great Lakes, inland New England, Appalachia — because the formula of fresh water, elevation and moderate latitude is what survives the projections. Discount the water-poor and the sea-level zones, the Southwest and the Gulf, because their trajectories all bend the same way. Follow the insurers, whose priced signal arrives years before the water does. And score the 2055 climate, not today’s. The climate map is the relocation map — read it before you buy the land.



1 Comment